A new study in Scienceexpress (Science magazine’s pre-paper-publication outlet) by Yude Pan of the U.S. Forest Service and colleagues finds that the net carbon sink in terrestrial forest systems across the globe has been expanding, taking up ever more carbon dioxide from the earth’s atmosphere. (A “sink” is a place where something-carbon dioxide, heat, water, etc…winds up.)
The net carbon sink in the world’s forests is made up of carbon uptake less carbon loss. Carbon (C) uptake is expressed as bigger trees and more dense forests, storage in leaf litter, dead wood, wood products, and in the soil. Carbon loss occurs through deforestation and burning. By analyzing “recent inventory data and long-term field observations coupled to statistical or process models” Pan et al. conclude that “the global net forest C sink was 1.0 plus/minus 0.8 and 1.2 plus/minus 0.9 PgC yr-1 for 1990-1999 and 2000-2007” - indicating that the terrestrial forest sink has been at least consistent, if not expanding, over at least the past 18 years (1990-2007). A “Pg” is a Petagram, which is 1 followed by 15 zeroes worth of constant grams. For comparative purposes, our federal deficit is 14 followed by 12 zeroes worth of inflating $$$.
In fact, if it were not for tropical deforestation, the world’s forests would be taking up a huge percentage of the carbon dioxide emitted from anthropogenic activities. Pan et al explain:
Notably, the total gross C uptake by the world’s established and tropical regrowth forests is 4.0 PgC y-1, equivalent to half of the fossil fuel C emissions in 2009 [emphasis added]. Over the period studied (1990-2007), the cumulative C sink into the world’s established forests was ~43 PgC, and for the established plus regrowing forests was 73 PgC; the latter equivalent to 60% of cumulative fossil emissions in the period (i.e., 126 PgC). Clearly, forests play a critical role in the Earth’s terrestrial C sinks, and exert strong control on the evolution of atmospheric CO2.
The researchers find that even though the greatest annual carbon flux is occurring in tropical forests, those fluxes nearly balance out with the result being that tropical forests are largely carbon neutral. That’s because the annual carbon sink from tropical forest growth and regrowth (after logging), is offset by continued deforestation. Temporal and boreal forests, on the other hand, prove to be net carbon sinks (Figure 1).
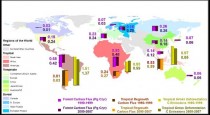
Figure 1. Carbon sinks and sources (Pg C yr-1) in the world’s forests. Down-direction represents sink, while up-direction represents source. Light and dark purple colors are for global established forests (boreal, temperate and intact tropical forests), dark brown and orange colors are for tropical regrowth forests from deforested lands; and yellow and yellow green colors are for tropical gross deforestation emissions. (source: Pan et al., 2011).
Pan et al. describe the situation in the United States as follows:
The U.S. forest C sink increased by 33% from the 1990s to 2000s, caused by increasing forest area, growth of existing immature forests that are still recovering from historical agriculture, grazing, harvesting, and environmental factors such as CO2 fertilization and N deposition. However, forests in the western United States have shown significantly increased mortality in the past few decades, related to drought stress, and increased mortality from insects and fires.
Basically, the bottom line is that the world’s forests systems are subject to a number of difference influences, many of which are rooted in human activities (logging, CO2 emissions, nitrogen emissions, climate change), but overall, are expanding their carbon reserves -a pretty good sign that the world’s forests are thriving.
When it comes to the actual numbers forwarded by Pan et al., there is not a lot that is particularly surprising. The net annual forest sink determined by the Pan et al. team was 1.04 PgC in the 1990s increasing to 1.20 in the 2000s (through 2007). The Fourth Assessment Report of the Intergovernmental Panel on Climate Change reported the annual net terrestrial carbon sink to be about 1.0 Gt/year for the 1990s, a value pretty similar to Pan et al.’s numbers.
And the good news reported by Pan et al. that the terrestrial carbon sink continues to expand, is also not particularly shocking. After all, we have known (and reported here at World Climate Report) for some time that the percentage of anthropogenic CO2 emitted each year that actually stays in the atmosphere has remained pretty constant for several decades, despite ever-rising CO2 emissions from human activities. In order for that to be the case, the earth’s total (land + ocean) carbon sink must be expanding. And as we know that CO2 makes plants grow faster, better, stronger, more nutritious, more water use efficient, etc., is seems only reasonable to expect that the terrestrial carbon sink in the world’s forest systems is expanding.
We thank Pan et al. for work further confirming that (with all due respect to the departed Climate Czarina) the world is getting greener, not browner.
Reference:
Pan, Y., et al., 2011. A large and persistent carbon sink in the world’s forests. Sciencexpress, July 14, 2011, doi:10.1126/science.1201609.
By Lubos Motl, The reference Frame
Brooklyn, 1911

July 15th, ‘11: The New World has been hit by a modern counterpart of the plague of Egypt in the form of a deadly heat wave. This phenomenon ultimately poured over to Europe as well and it began to plunder the Czech lands, too.
In the wake of the tropical weather, the New York City has been completely crippled.
The New World was struck by a new-age plague of Egypt. “The commercial activities have largely come to a halt. The thermometer is climbing to breathtaking heights. Some people are grovelling on the shadowy side of the sidewalks and one can’t find any humans on the squares. Who doesn’t have to, doesn’t leave his house and is looking for the coldest places of the buildings and their basements,” the situation in New York was presented in the Saturday issue of the Czech daily called “National Politics” (Narodni politika) from July 15th, ‘11.
Just to be sure, it was 1911.
The fight for ice
It was a literally murderous heat wave. “As a consequence of the huge heat wave, additional 50 people died on the day before yesterday,” Saturday’s “National Politics” (a popular daily nicknamed “Politicka”, a female politician, in Prague).
New Yorkers were therefore trying to escape from the overheated city en masse. “Next to New York, two refugee camps have been built out of tents which attracted tens of thousands of people. One of them is near Pelham Bay, in the proximity of the sea, and another is on the Hudson River. It’s relatively better in those areas.”

New York 1911 heat wave according to a caricature from those times. [LM doesn’t quite understand the point of the drawing but he guesses that it wouldn’t be PC today haha.]
New York has also felt a shortage of ice and near one of the ice houses, a heartbreaking fight has erupted. According to “National Politics”, one could also hear the people whining in this way:
“My husband is lying on his bed and he will die unless I will bring him a piece of ice.”
--------------
“My child is sick because it couldn’t have been given a piece of ice by me.”
There was no rain until April: potatoes are like nuts
The Czech press was afraid that the American heat wave would soon reach Europe, too. It’s because the Czech lands had experienced some higher-than-average, warm weather at least until Spring 1911.
“After we commited all of our sins, we don’t even have the chance that the horrendous heat wave of America shall remain constrained by the beaches of the New World. From England, it is being announced that six people have died of aprication,” the editor of “National Politics” was contemplating.
And he wasn’t mistaken. The lethal wave did come to Bohemia, Moravia, and Silesia and the heats experienced in 1911 haven’t been surpassed so far. Not even in the legendary year of 1947 when pedestrians were allegedly able to wade through the Danube River near Vienna.
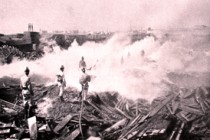
One of the wildfires in Summer 1911 caused by the heat wave. The picture comes from Vienna.
Already the newspapers published on July 15th were informing about some local catastrophes. For example, near the St John Creek on the territory of the villages of Neveklov and Nedvezi, the people haven’t experienced a single rain between April 16th and July 15th. “The whole landscape is looking towards the coming hunger and misery. The wheat has become dry, oats and barleys have almost no spikes. The size of the potatoes matches those of the hazelnuts. You can’t find any trefoil or aftergrass on the meadows. The grass fields are bald and dessicated while cattle feeds itself by the dry fodder hiding in the soil,” the daily offered some details about the impact of the heat wave on Central Bohemia.
When the devils are getting married and the wheelbarrows are falling from the heaven
Every day, the situation in the Czech lands as well as the whole monarchy was rapidly deteriorating and the Centennial Courier of Mr Ivan Motyl will surely recall some of the events again.
One report from the town of Opava sent on July 25th, 1911, reads: “From Opava it is being announced that 35 persons have been suffering from aprication. The heat is terrifying.” On the same day, the papers published two reports from Budapest: “Field caretaker Mr Josef Pupp has died of heliosis. The heat has reached 52 degrees Celsius.”
Of course, the heat episodes were alternating with torrential rains, hailstorms, and cyclones. In Summer 1911, the weather was presenting itself in a considerably wilder way than what we could see in this year so far. Despite all the theories about global warming, the weather is still the same. Sometimes it’s simply necessary that “all the devils are getting married, the wheelbarrows are falling from the heavens, and it’s showering like from a watering can so that you wouldn’t banish a dog.”
There were also horrible, devastating floods in May 1911. See post here.
By Roger Pielke Jr.
Real Climate has an interesting post in which Gavin Schmidt reports that, according to a new analysis, errors in climate data (ocean temperatures) may lead to a reduction in the 1950-2006 global temperature trend of 17%, perhaps more. This is a big deal scientifically and speaks to the certainty - in this case excessive—with which climate science is often reported, especially by the IPCC.
As far as Real Climate is concerned it is interesting that they seem to think that the story here is not the revisiting of the science of global temperatures, but how they can score some points against fellow bloggers (Maybe trying to change the subject?).
Unfortunately, in my case (and according to Steve McIntyre, in his as well) they engage in some fabrication to try to score those points, incorrectly claiming that I had offered a “prediction” of how the science on this issue would evolve. When called on this, Gavin first admitted that he could be confused (he was), but when I pointed out to him exactly how he was confused, he decided to dig in his heels.
Actually, on Prometheus I and a number of commenters did what people normally do when they hear about interesting science—we discussed, probed, questioned, hypothesized, explored. Schmidt seems upset that people engaged the subject at all. For my part, I discussed the issue of temperature adjustments in some depth (e.g., here) and offered up a few conditionals that spanned the scope of possibilities (and event had an exchange with Gavin et al. on the subject). But I offered no predictions of how the science would turn out. As readers here know, I predict football but not science.
Taking a look back at my discussion of the temperature trend issue at Prometheus from 2008 for the first time since it was written, it actually stands up pretty well: I asked, “Does the IPCC’s Main Conclusion Need to be Revisited?” The answer would seem obviously to be “yes” if it is indeed the case that 17% of the global surface temperature trend that the IPCC thought it had fully accounted for was actually measurement error. Oops. But that sort of thing—learning something new about something we thought we had settled—happens in science, and it should not be a surprise or a scandal.
But that is just science. On the apparently much more important issue of the blog wars, Gavin Schmidt has decided to let his fabrication stand and has encouraged and published the usual cheerleaders piling on, adding to the misinformation in the comments, unfortunately making this post necessary. Richly ironic. I do not miss sparring with those guys.
Icecap Note: Ocean heat content is a good measure of the ocean changes. NOAA global OHC to 700 meters showed a warming during the period of the warm PDO starting in 1979 that ended with the PDO cooling after 2003. Atlantic warming which lags the Pacific is delaying the inevitable decline since CO2 warming has been discredited unequivocally and given the cooling oceans and declining solar input.
The tropical Pacific shows little change over that period over the entire Pacific Basin. This may be the strongest evidence that the degree of importance of GHGs is not what you are lead to believe as the theory predicts the warmest atmospheres in the tropics and since the atmospheric warming is allegedly supposed to radiate heat down to the surface, oceans should show significant warming. They don’t clearly.

Kevin Trenberth has called it a travesty they can’t explain the lack of warming. Of course unlike the sun which heats water down to many meters, radiation can only heat the top few mms. Some have responded the heat bypasses the top water and finds its way to the deep oceans without speculating on a mechanism. Do you suppose the increase in these guys has something to do with it.